
See the primary market in detail
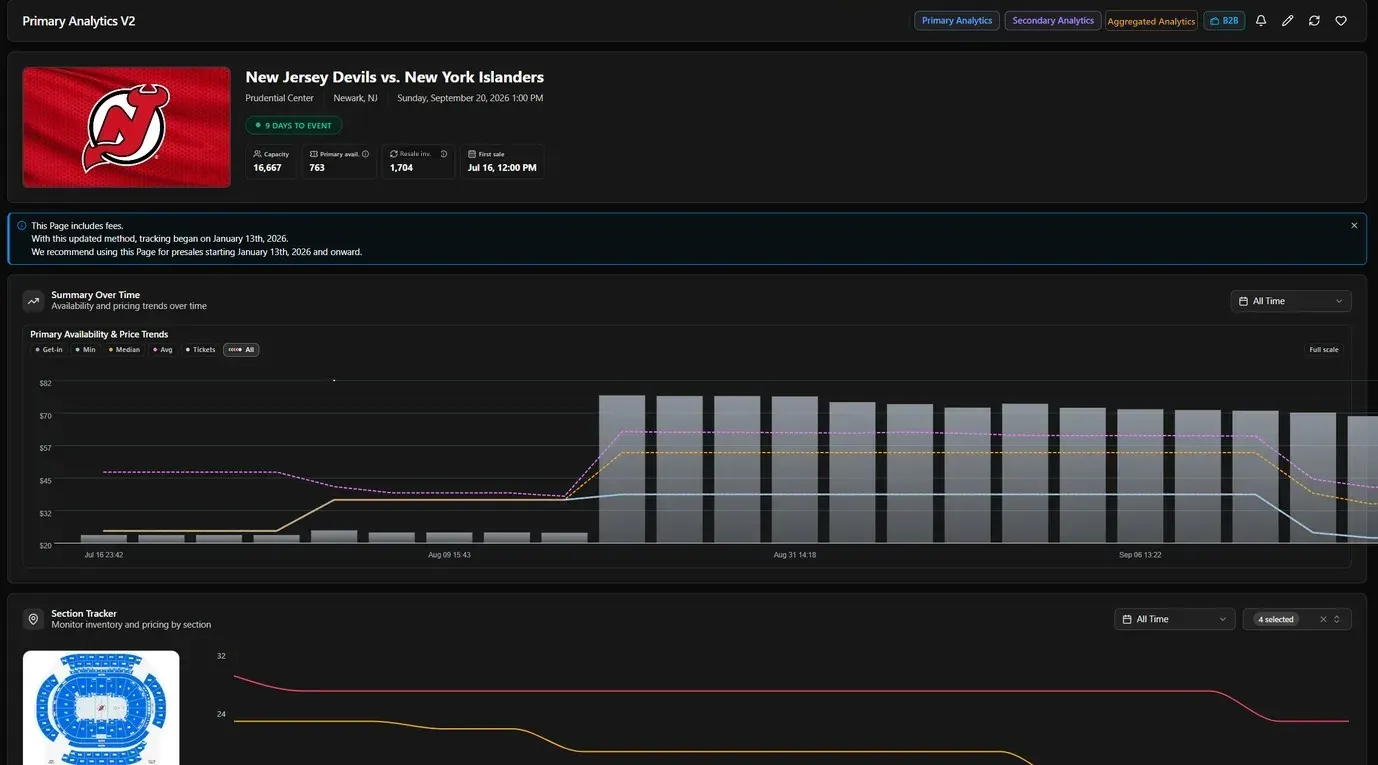
Track how primary inventory changes from onsale through event day, with availability, pricing, section-level movement, and historical trends all tied to the same event.
- Track primary availability and inventory over time
- Follow get-in pricing and availability trends
- See section-level pricing and inventory on the venue map
- Identify the biggest daily and weekly inventory changes
- Pull fresh primary data on demand with Live Data Checker
Track the secondary market in real time
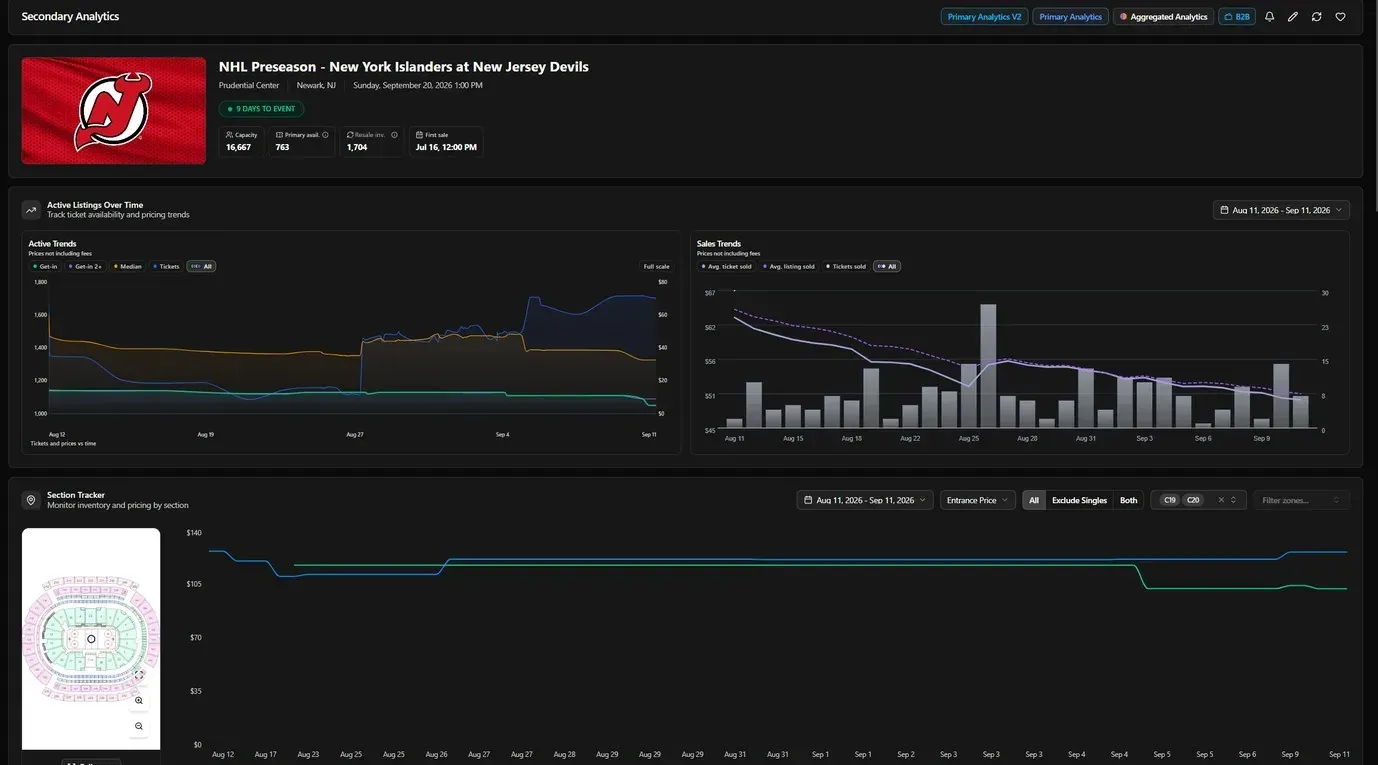
See how listings, pricing, and sales move over time for any event, with flexible date ranges and historical trends all in one view.
- Track get-in, get-in 2+, median price, and ticket count
- Compare average sold price with current listing prices
- Follow daily ticket sales and sales velocity
- Analyze trends across any custom date range
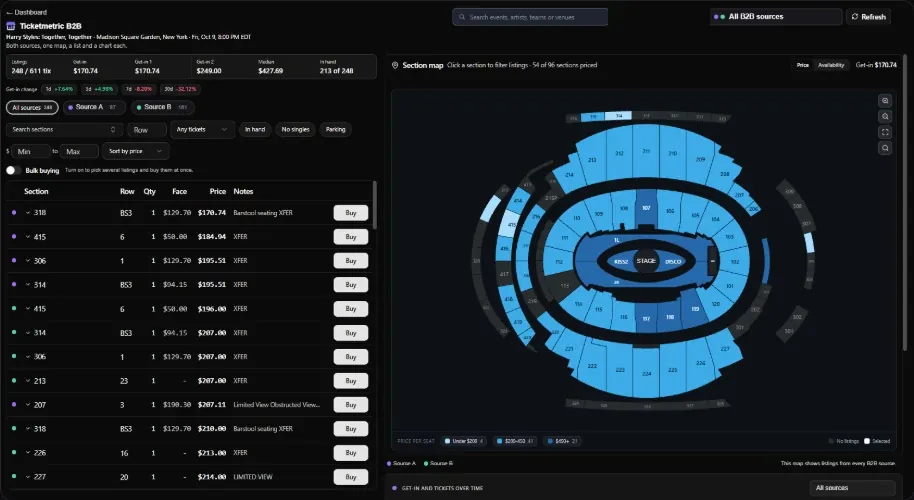
Break the market down by section
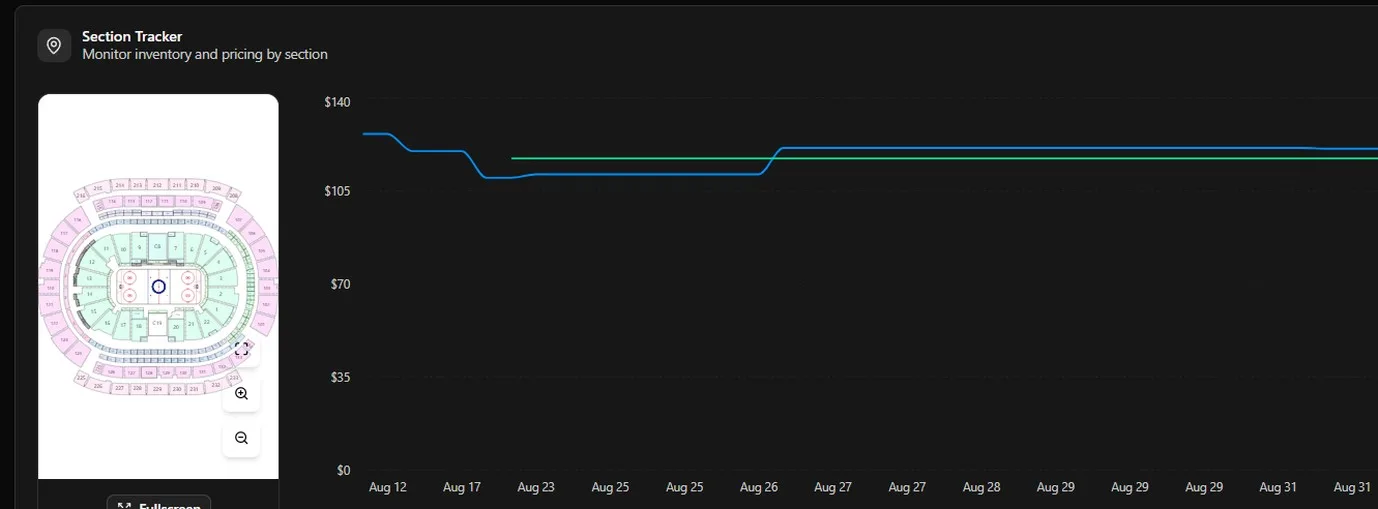
Use the actual venue map to track pricing, availability, and market movement for any section or zone, with the ability to include or exclude single tickets.
- Interactive venue map
- Filter by zone or section
- Track entrance pricing by section
- See section-level inventory and trends
- Include or exclude single tickets
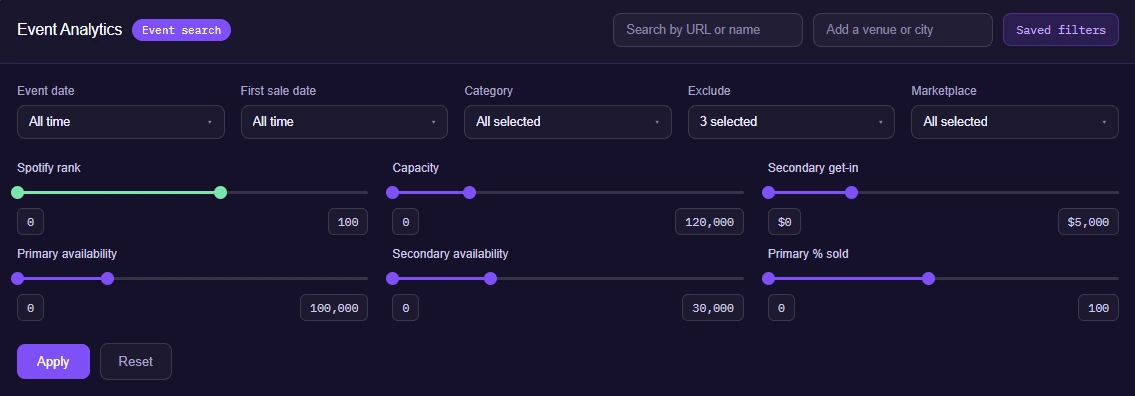
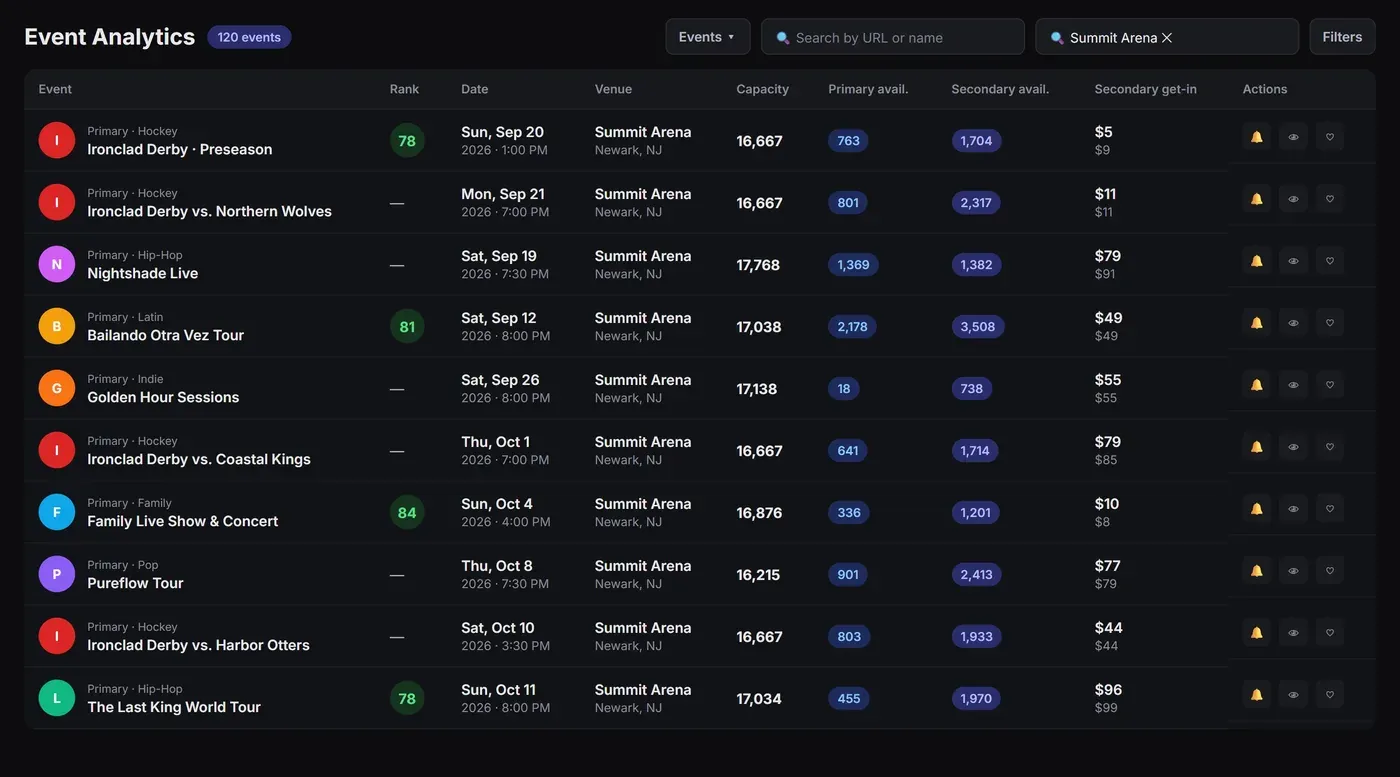
Screen hundreds of thousands of events in seconds
Combine event date, first sale date, category, marketplace, capacity, artist rank, primary availability, secondary inventory, get-in price, and sell-through to surface the events that match your criteria.
- Filter by event date or first sale date
- Narrow by category and marketplace
- Set ranges for capacity, availability, and get-in price
- Filter by artist rank and primary % sold
- Save your filters and reuse them anytime
See any event end to end
Search an artist, venue or event and get the whole picture, or let our team walk you through it.
Explore more features
Every tool reads from the same data, so they work best together.
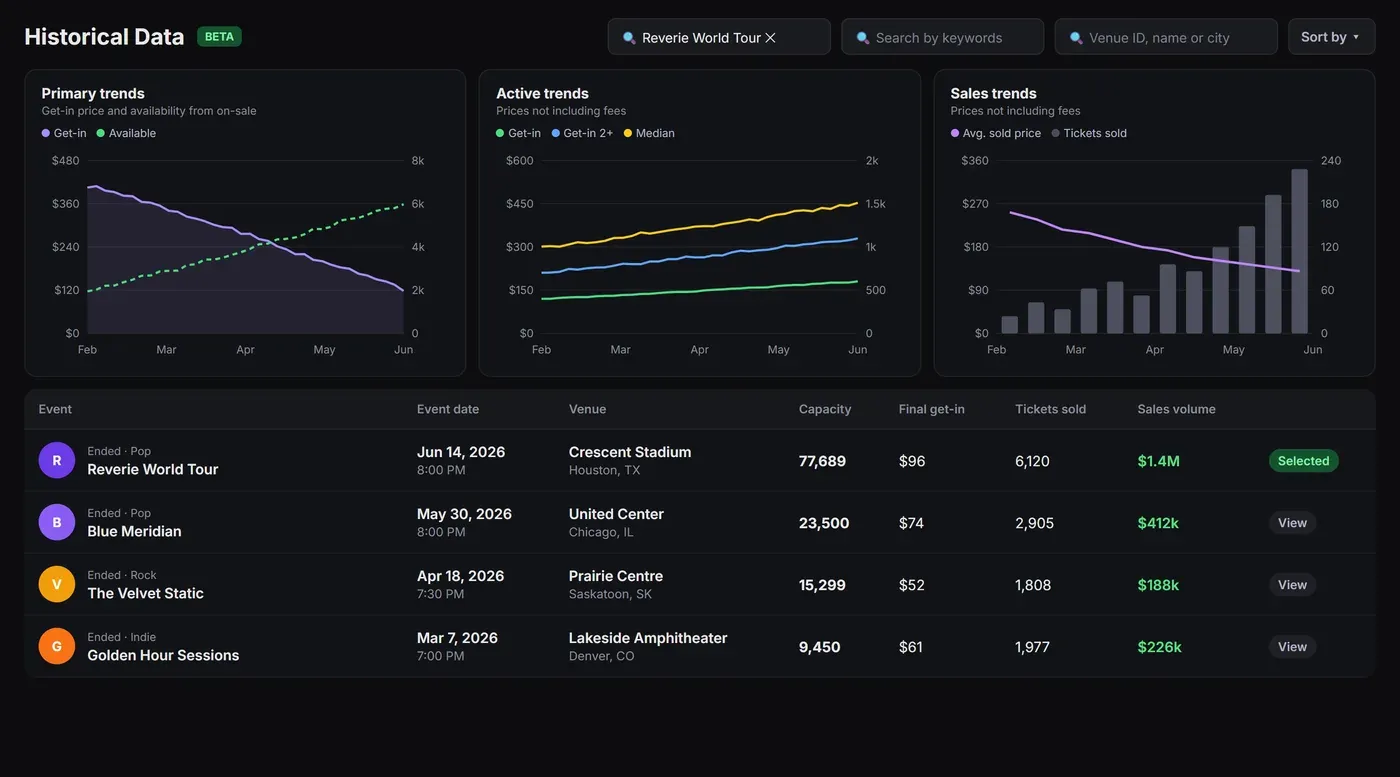
Historical data
How any past event really sold
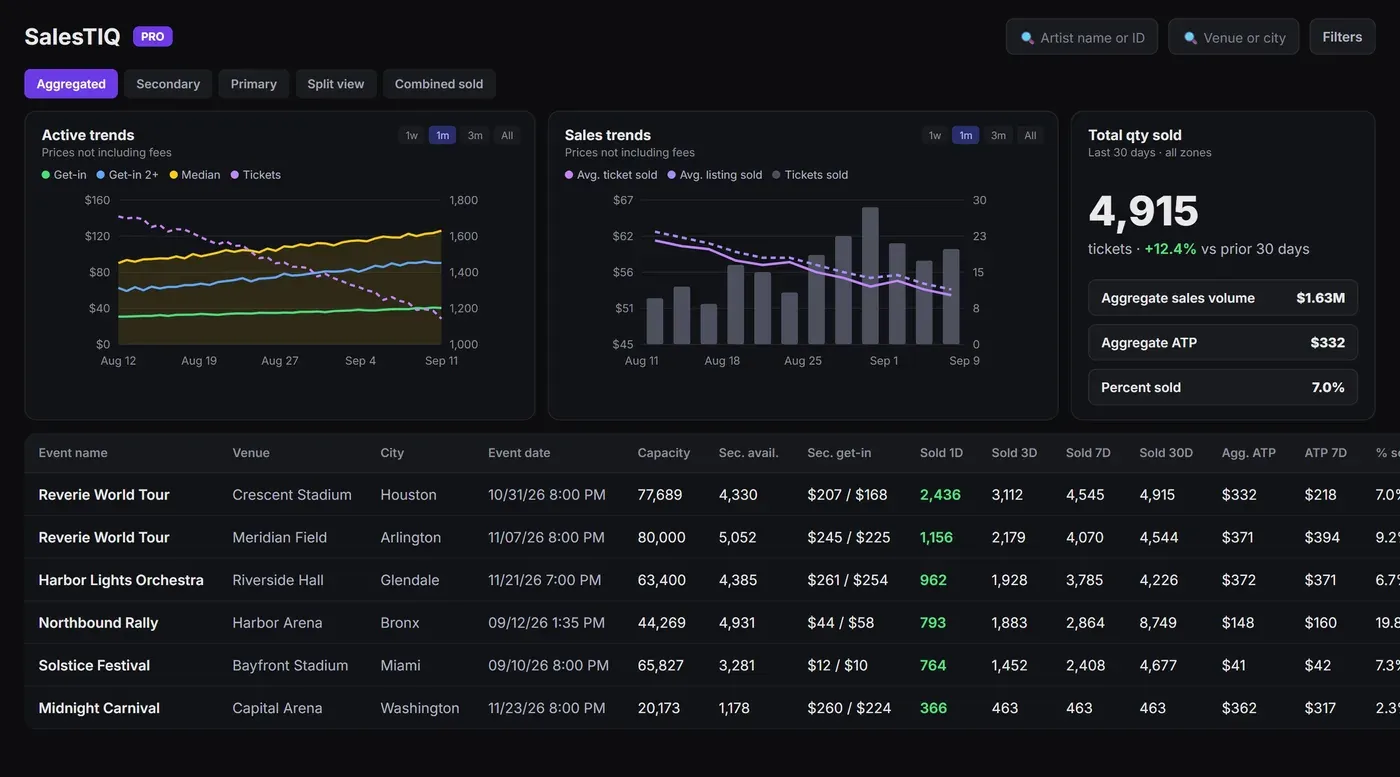
SalesTIQ
Sales, pricing and demand across every market
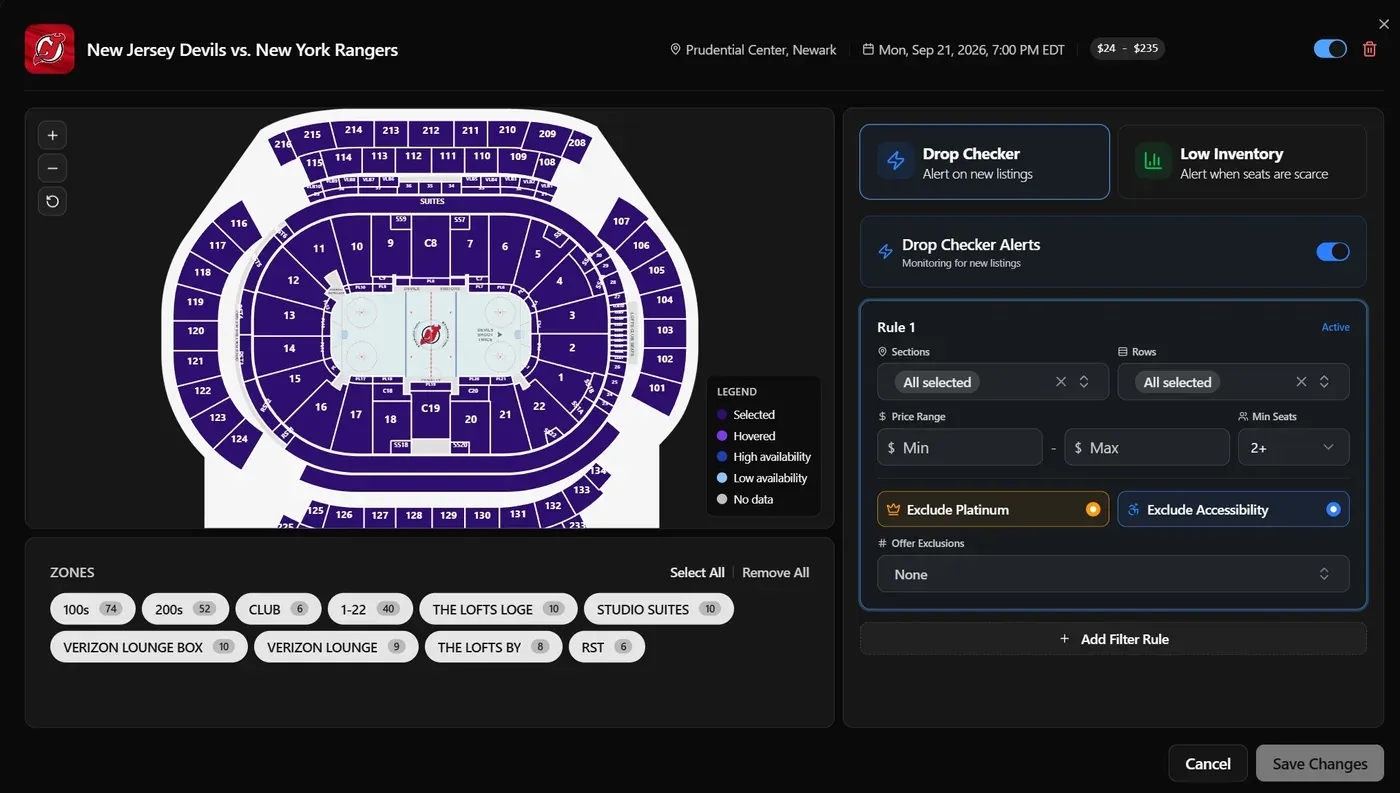
Drop & low-inventory alerts
Know the moment inventory moves
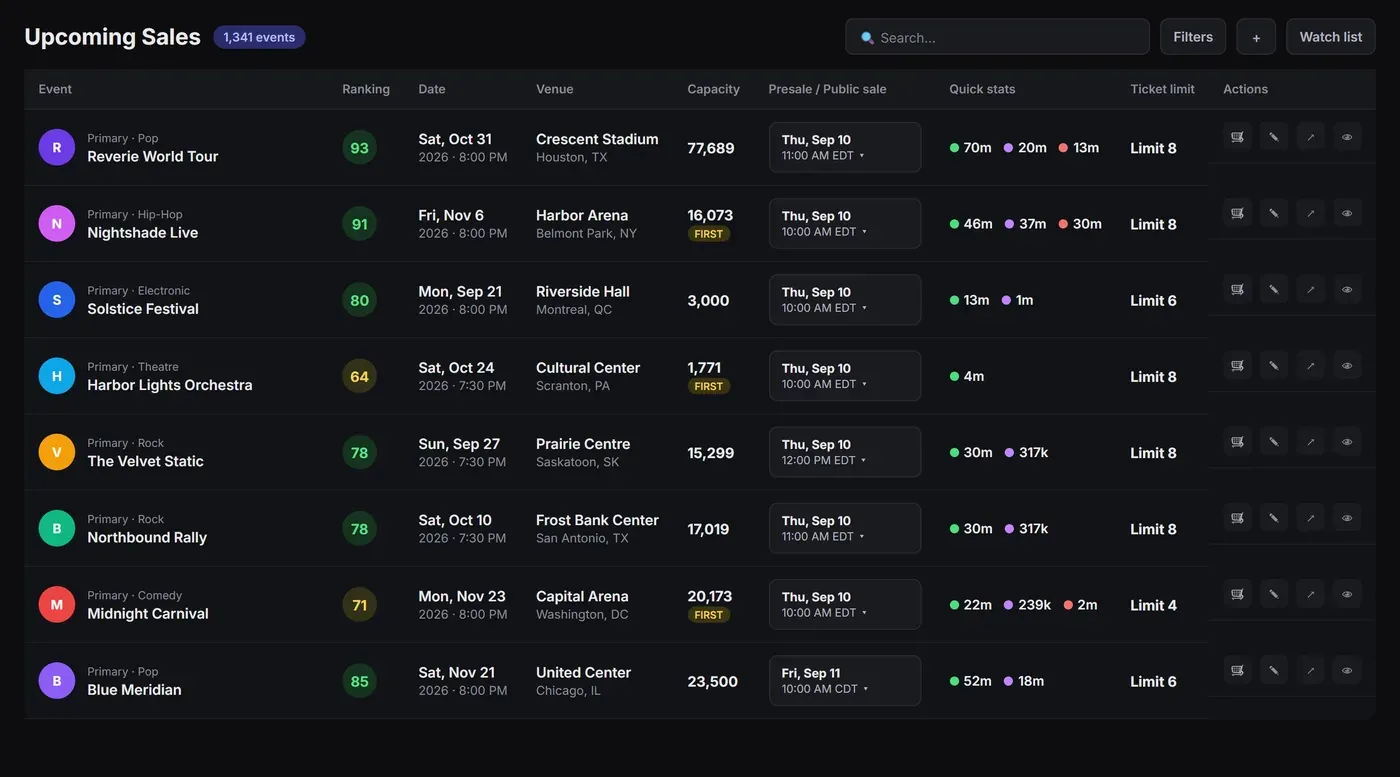
Upcoming sales
Every presale and on-sale before it happens
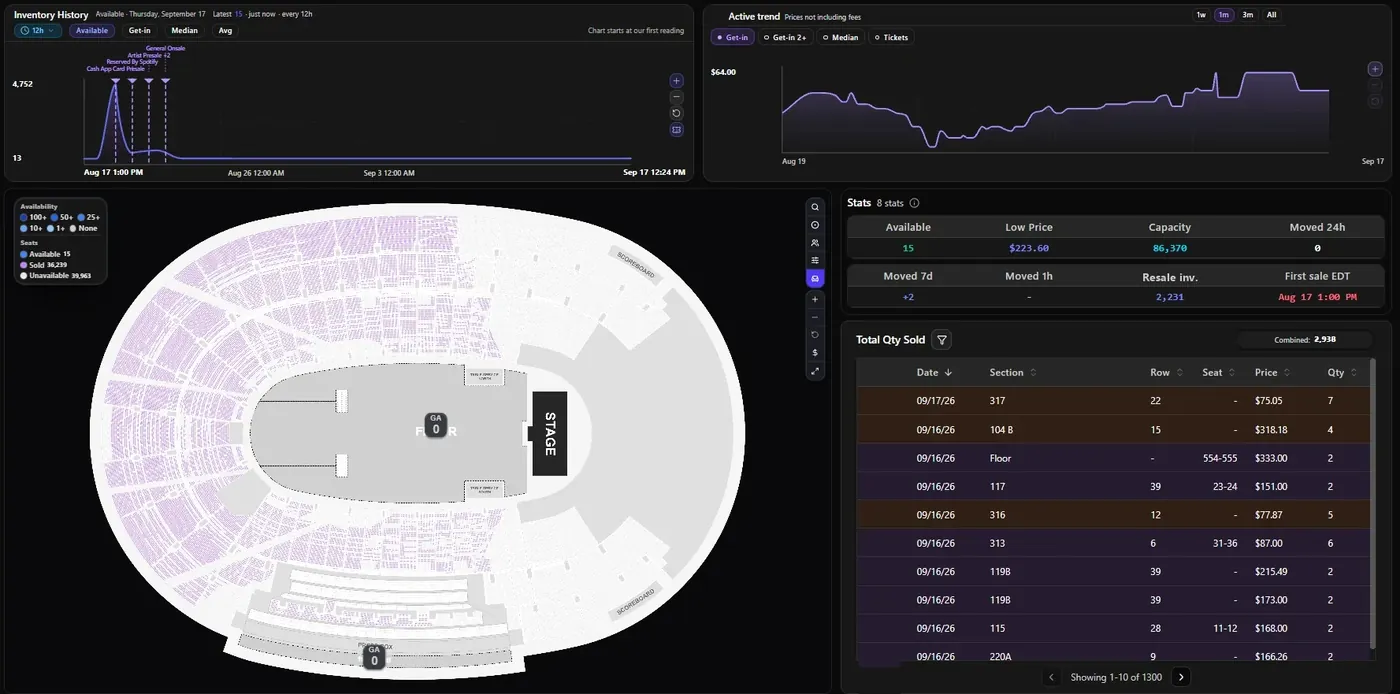
Live map view
Primary inventory seat by seat, live
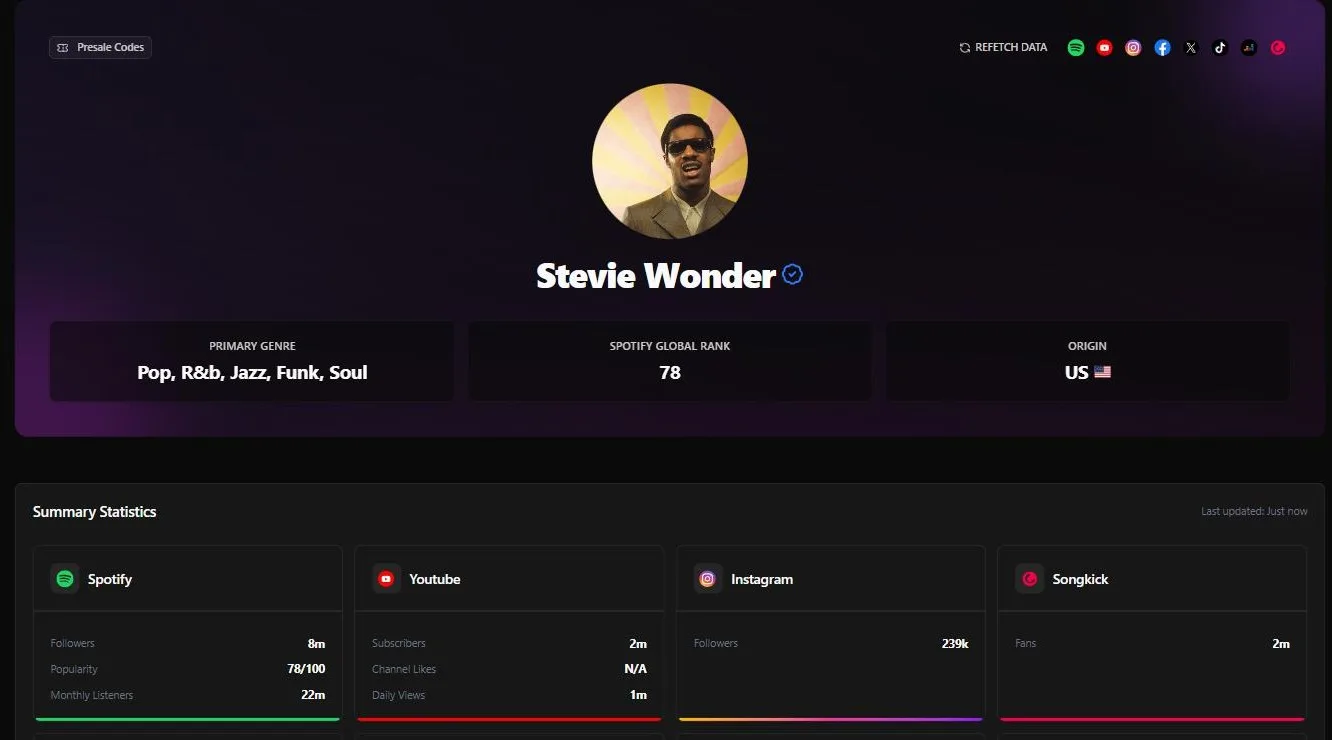
Artist Metrics
Audience size and location for any artist
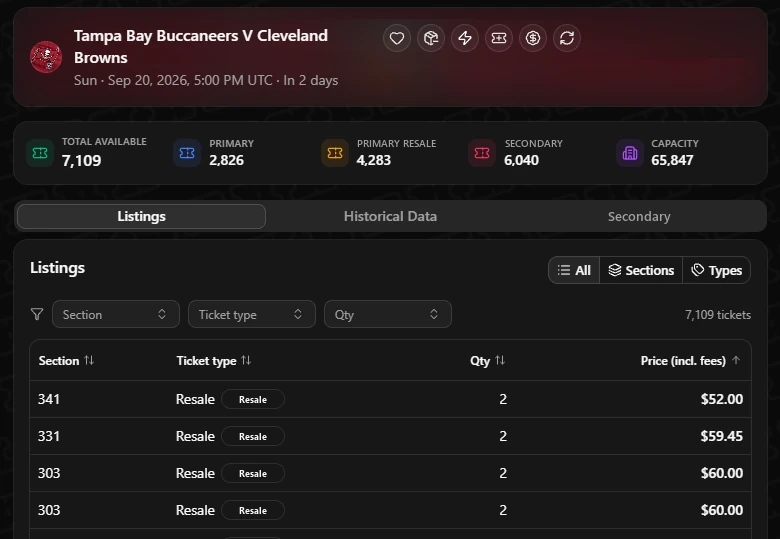
Browser extension
The same data on the ticket page you're on
Ticketmetric B2B
Multiple B2B sources in one dashboard