
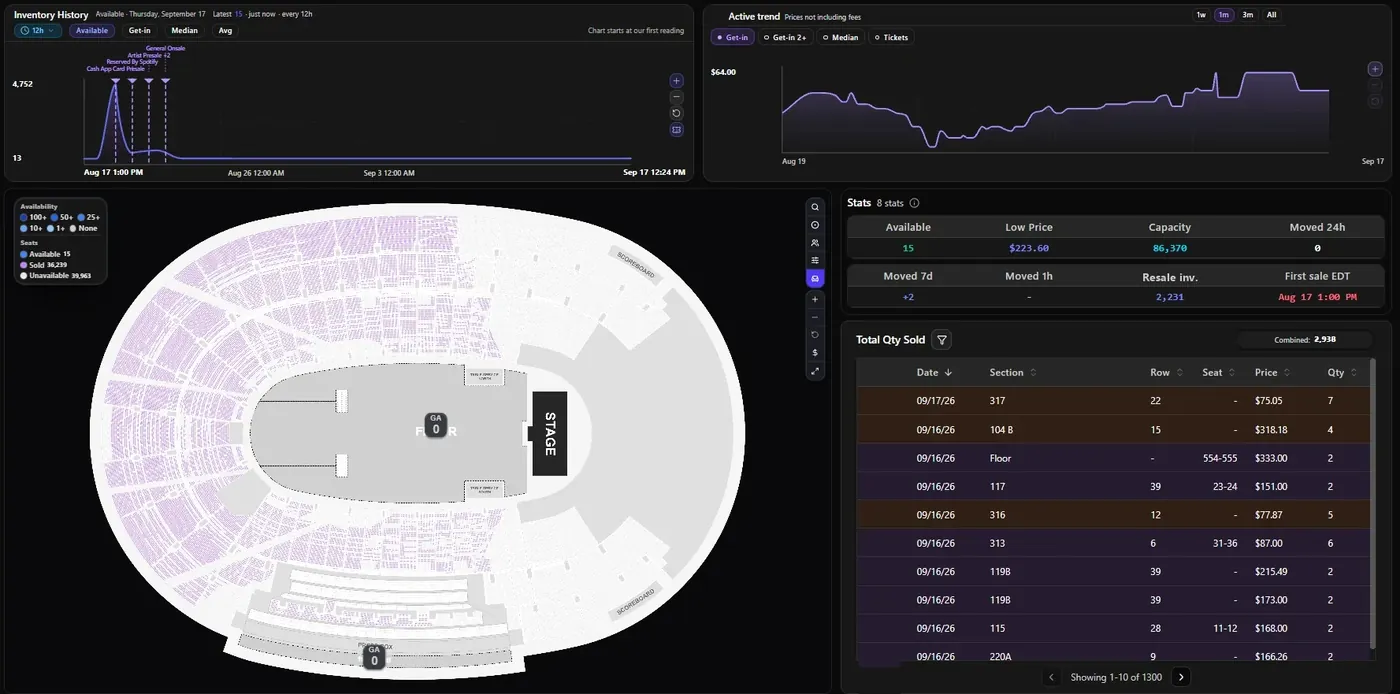
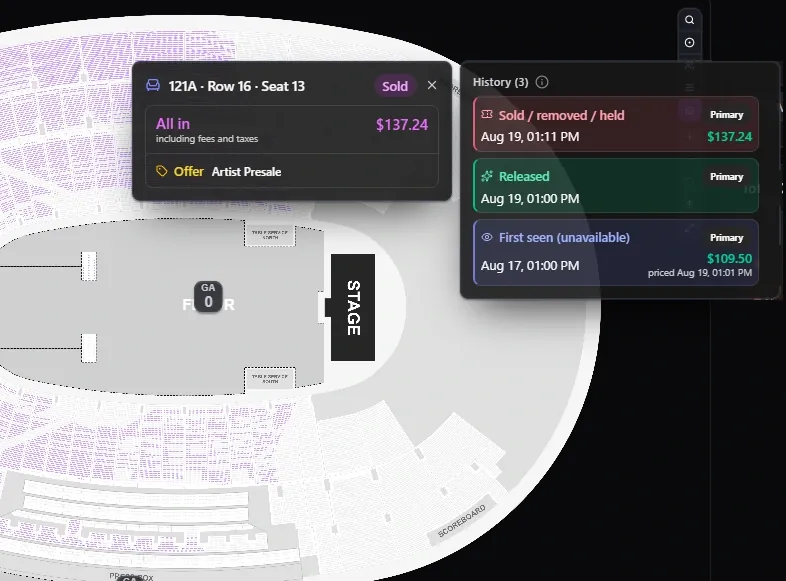
Every seat, released to sold
The map view shows each seat in the venue as available, sold or unavailable, next to an inventory history chart that marks every presale, so you can see when tickets were released and how fast they went.
- Seat-level map of available, sold and unavailable
- Inventory history with presale markers
- Released, capacity and lowest price
- Each seat's history, from first seen to sold
- How much moved in the last hour, day and week
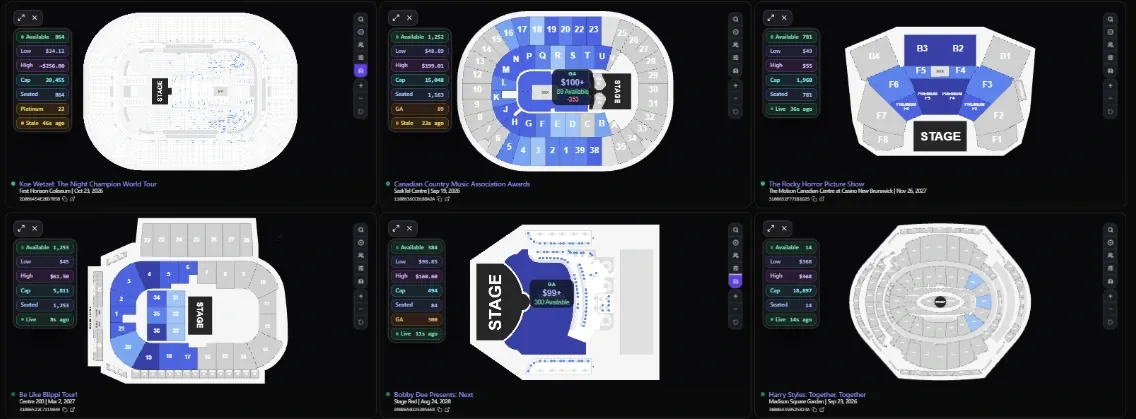
Sit in on a presale and see what’s moving
Grid View lets you monitor multiple events at once with live venue maps showing exactly which sections and seats are still available, alongside real-time pricing and inventory movement as tickets are released and sold.
- Live section and seat-level availability
- See exactly which seats remain available
- Track low and high prices in real time
- Watch inventory move throughout the onsale
Watch the next drop seat by seat
Open it on your next onsale, or let our team show you how brokers use it during a presale.
Explore more features
Every tool reads from the same data, so they work best together.
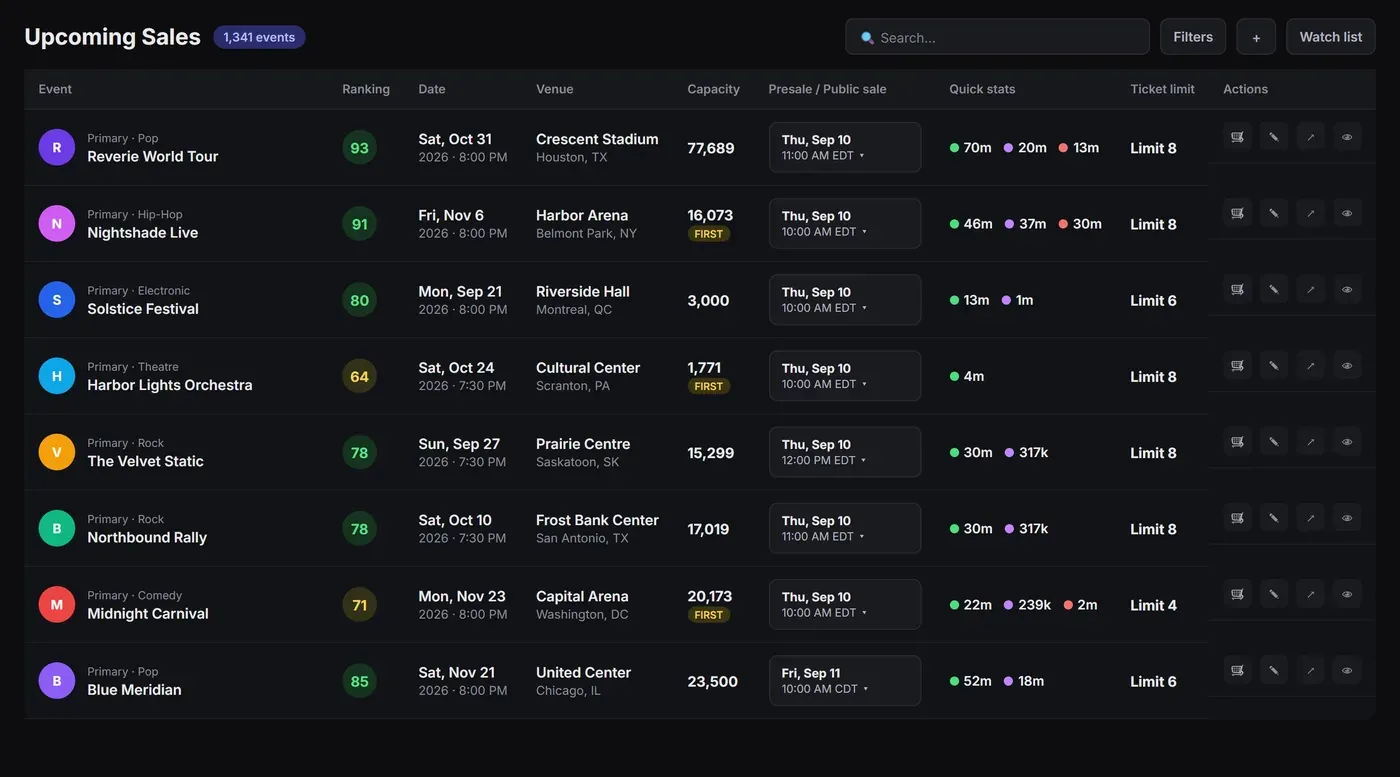
Upcoming sales
Every presale and on-sale before it happens
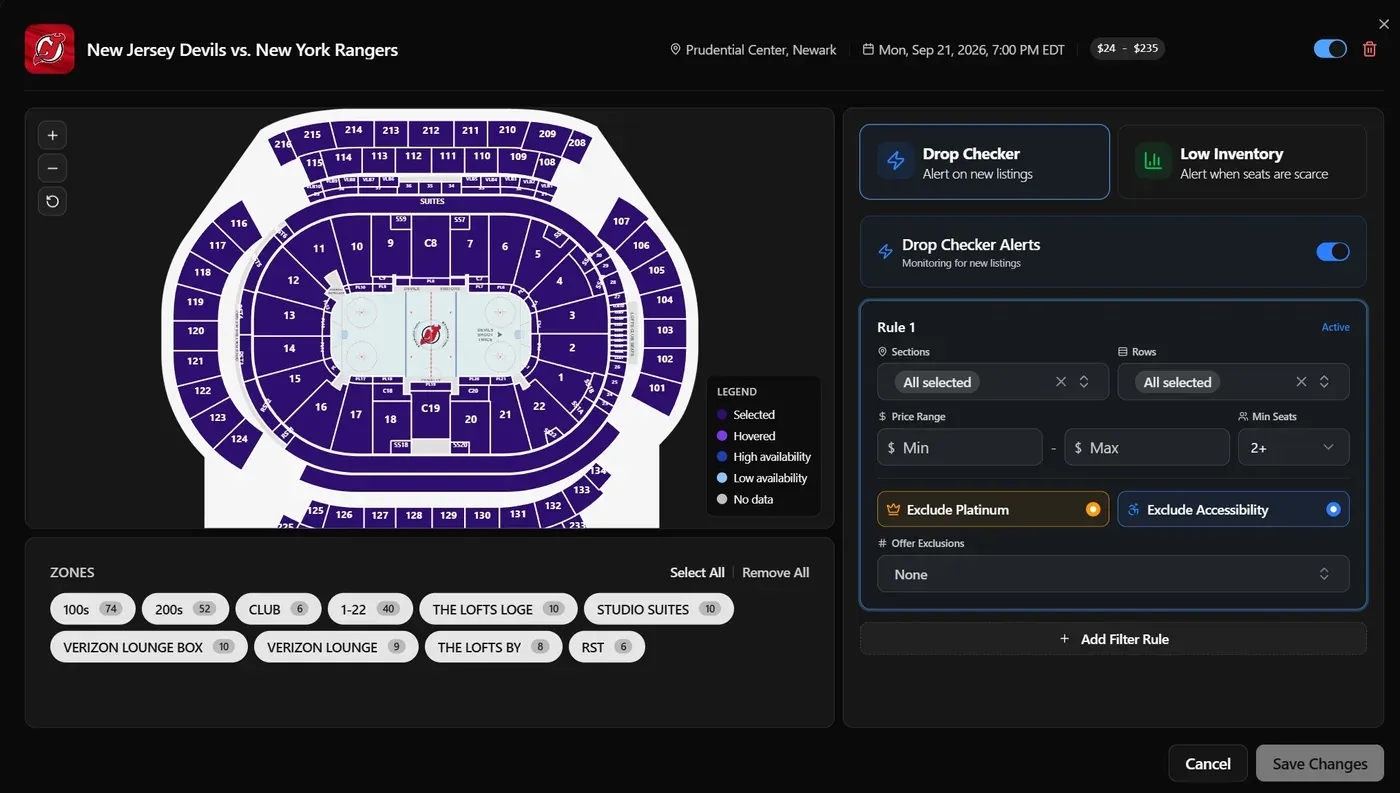
Drop & low-inventory alerts
Know the moment inventory moves
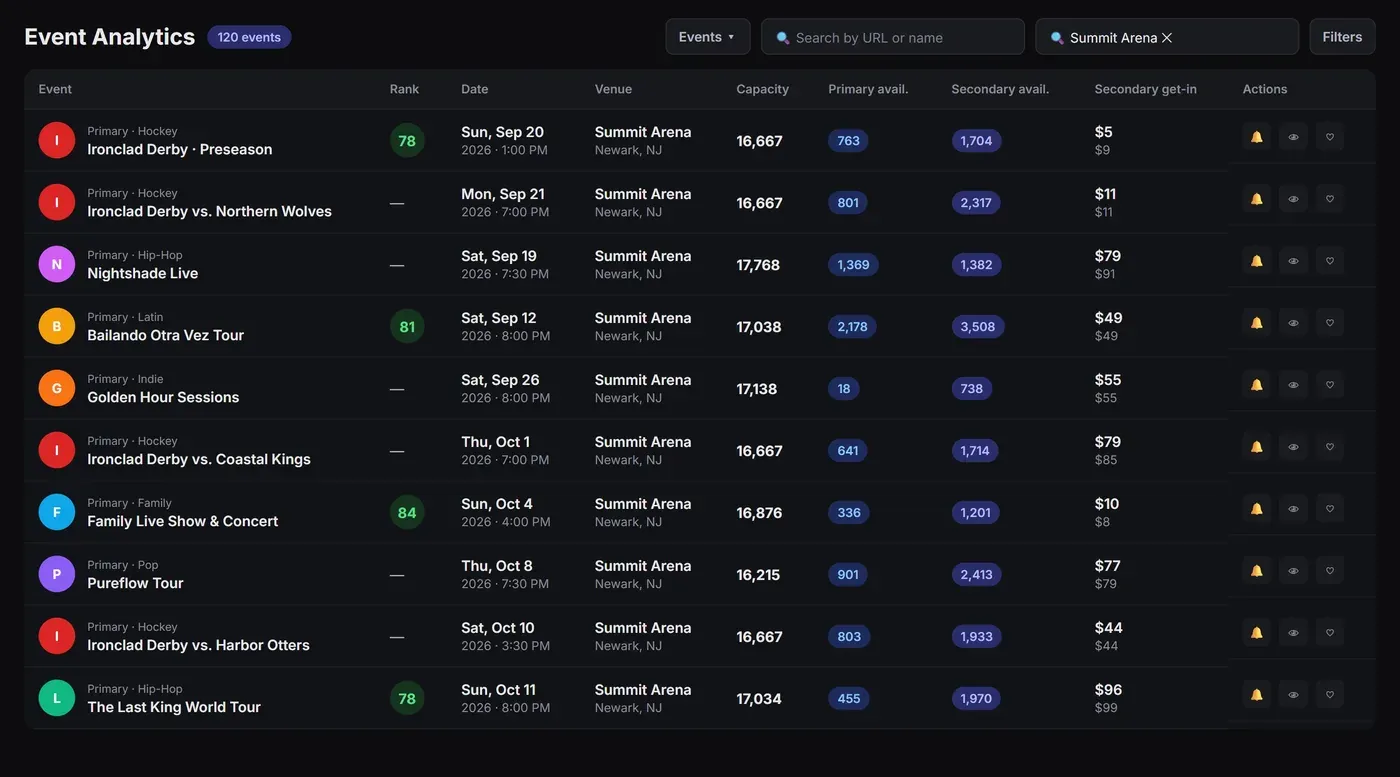
Event Analytics
Primary and secondary data for any event
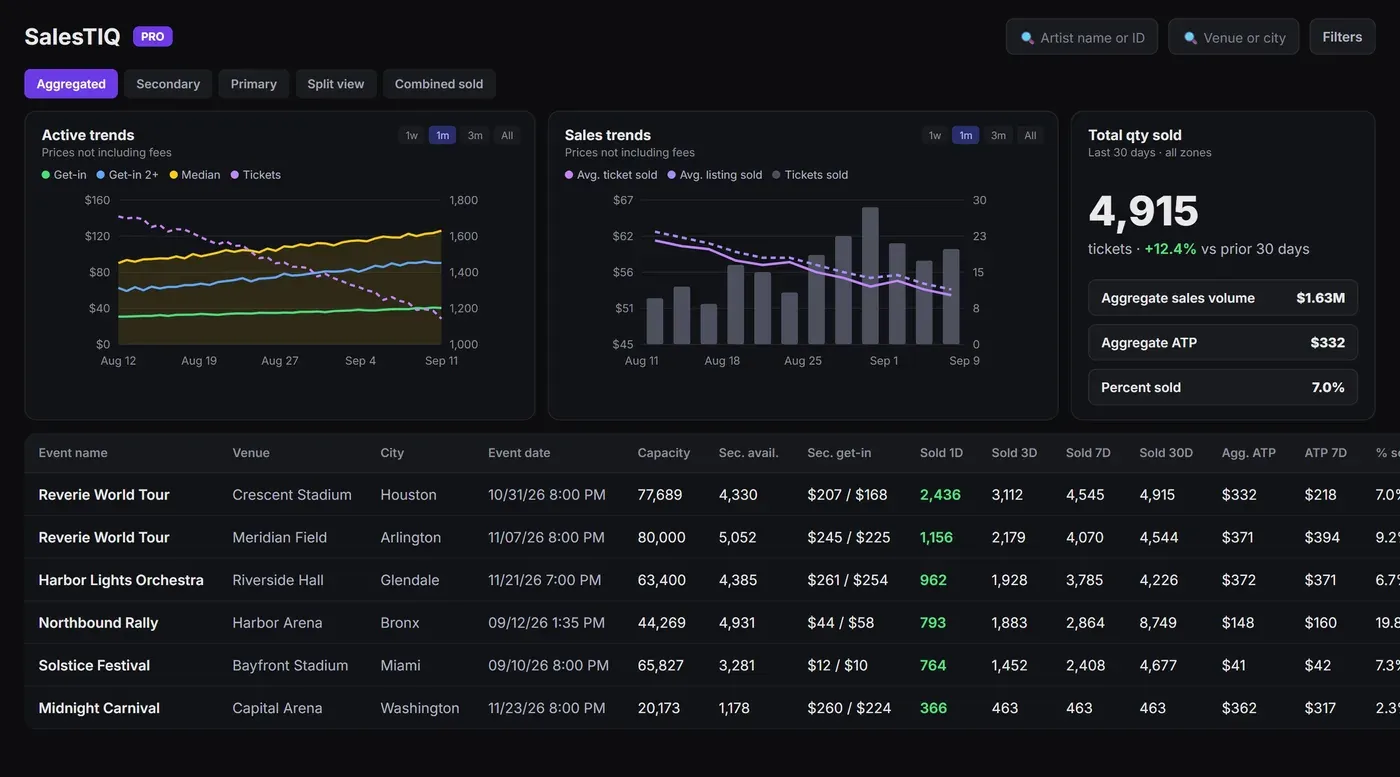
SalesTIQ
Sales, pricing and demand across every market
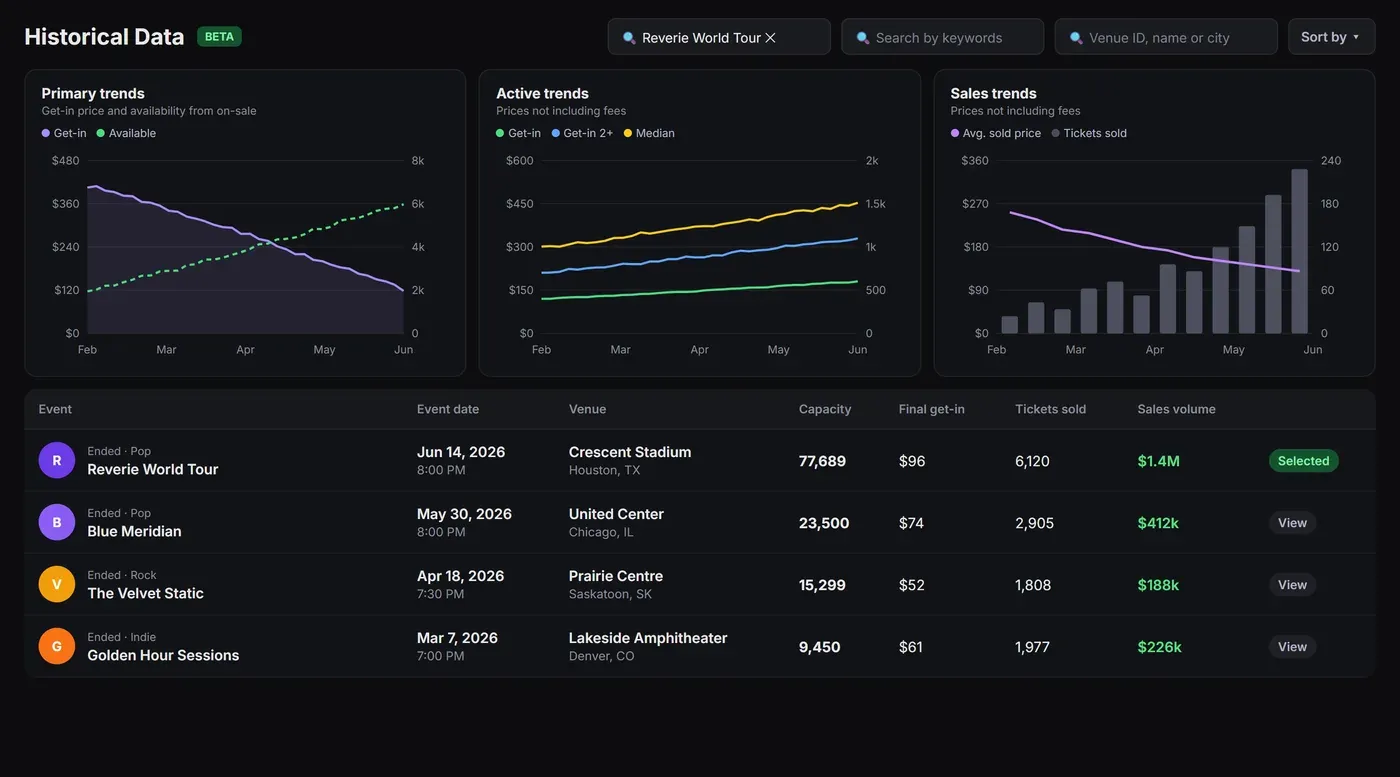
Historical data
How any past event really sold
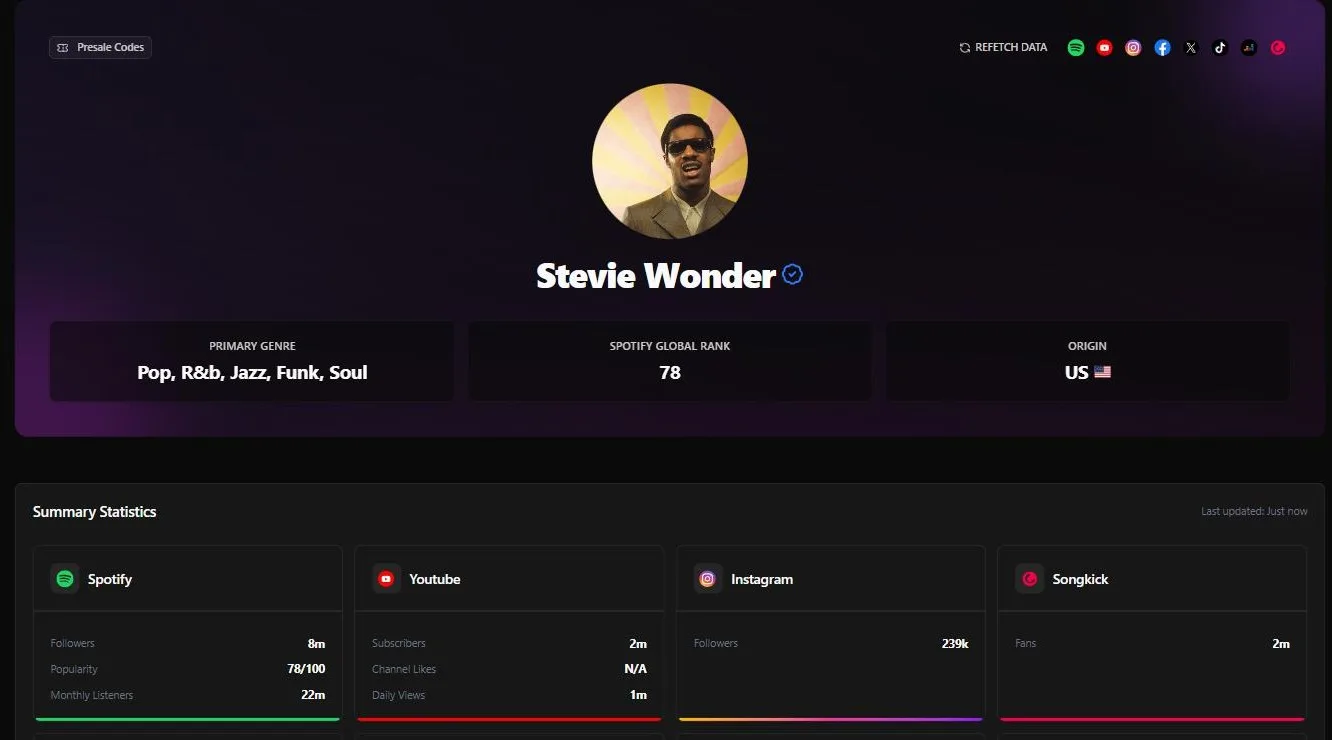
Artist Metrics
Audience size and location for any artist
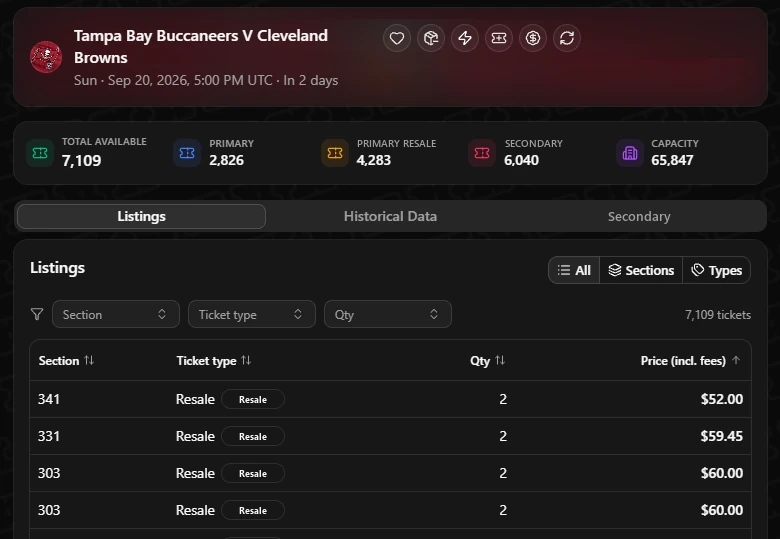
Browser extension
The same data on the ticket page you're on
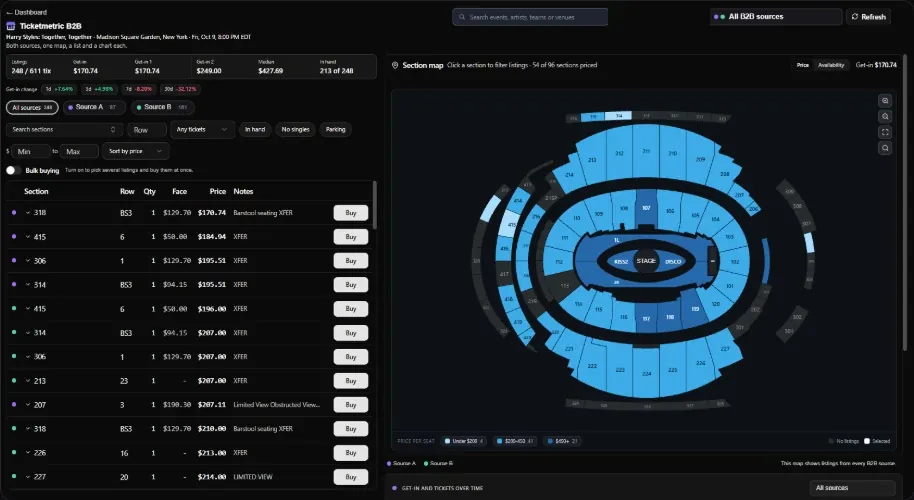
Ticketmetric B2B
Multiple B2B sources in one dashboard