Live sales
Watch sales land as they happen
Every transaction as it closes, with event, section, row, quantity and price.
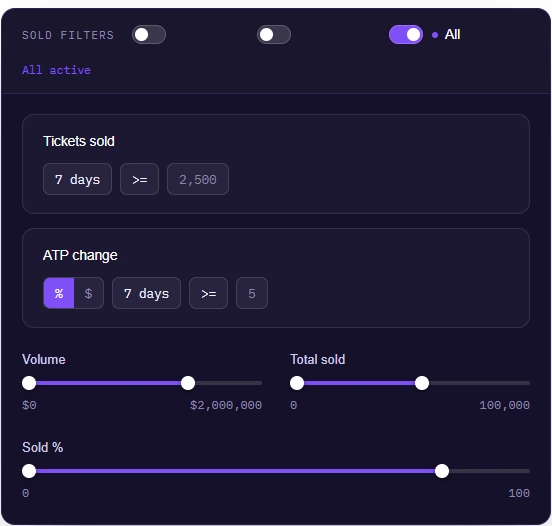
Filters
Filter across sales, pricing, inventory, volume, timeframe, and marketplace to surface the events that match your criteria. Combine multiple conditions, then save your filters for quick access anytime.
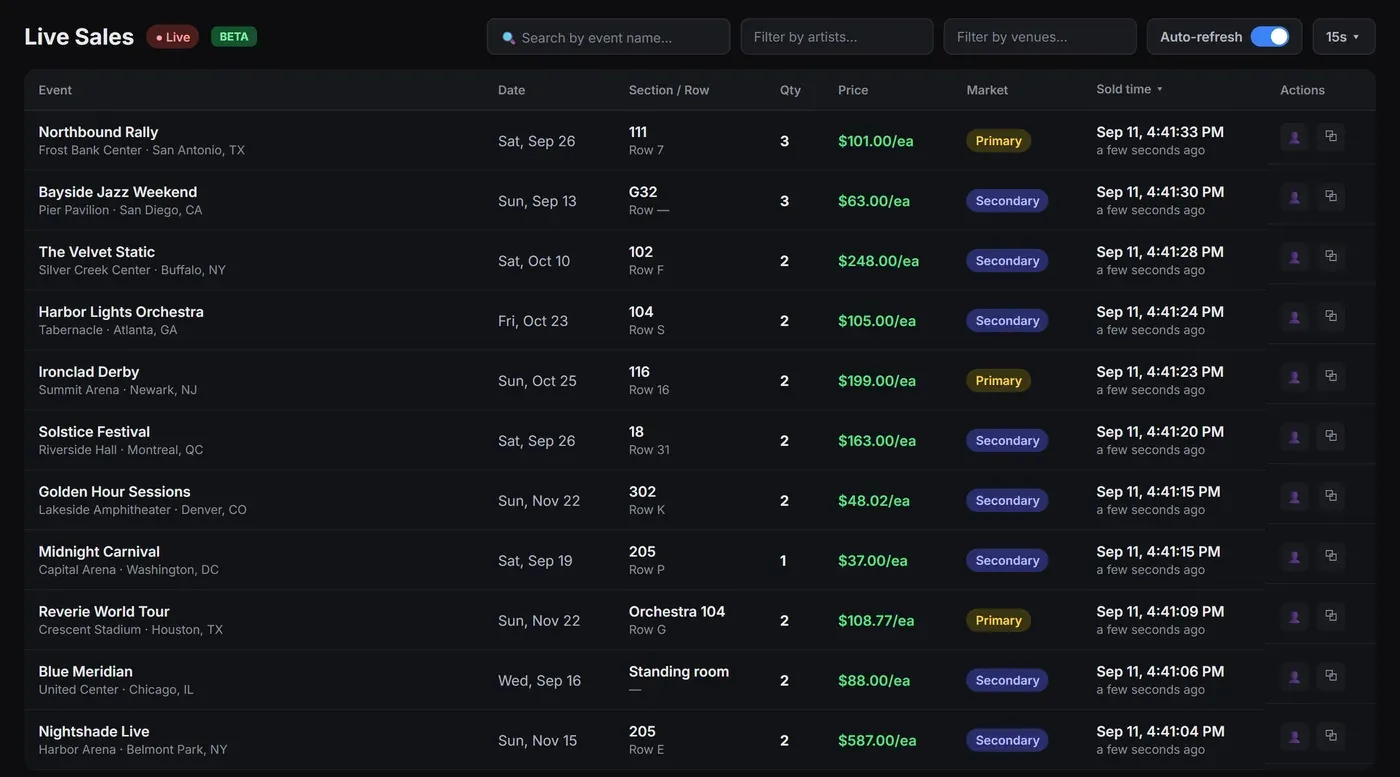
Live sales
Every transaction as it closes, with event, section, row, quantity and price.
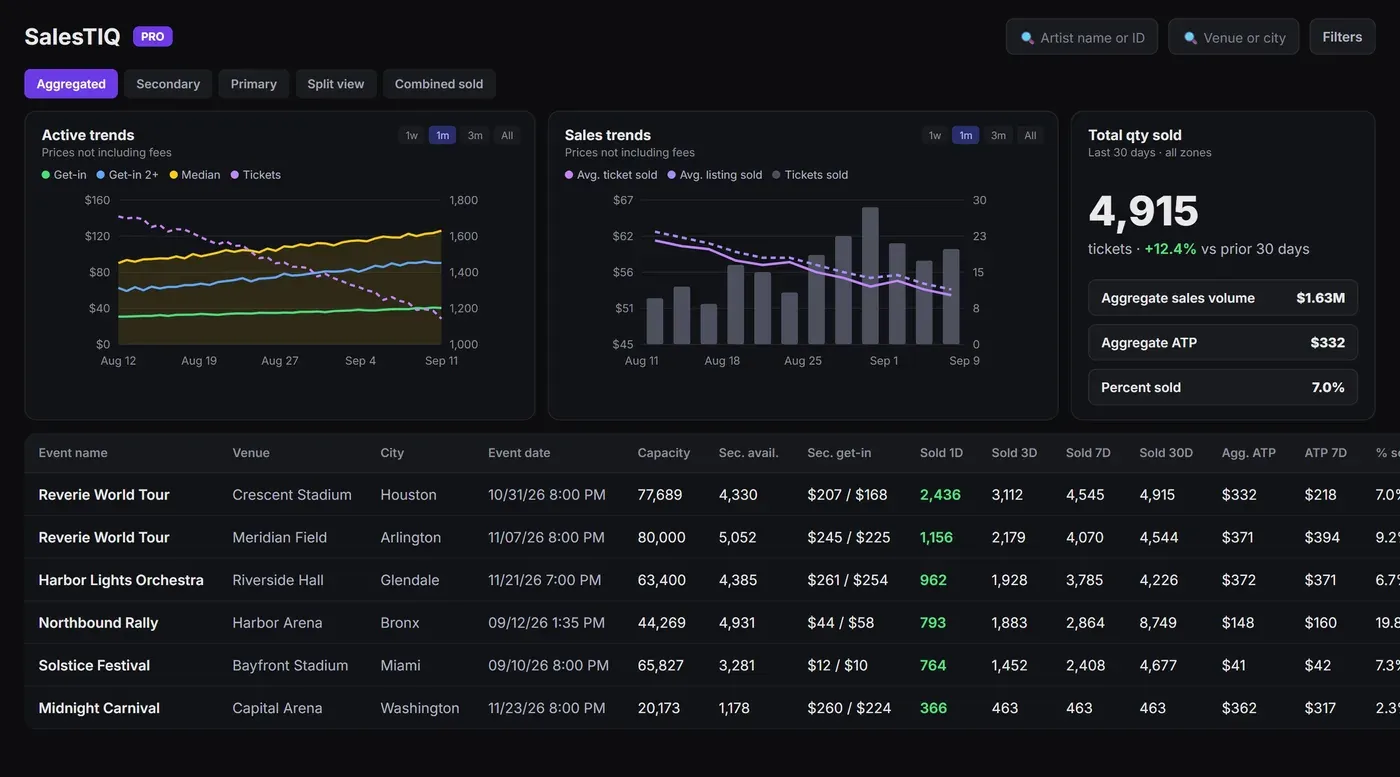
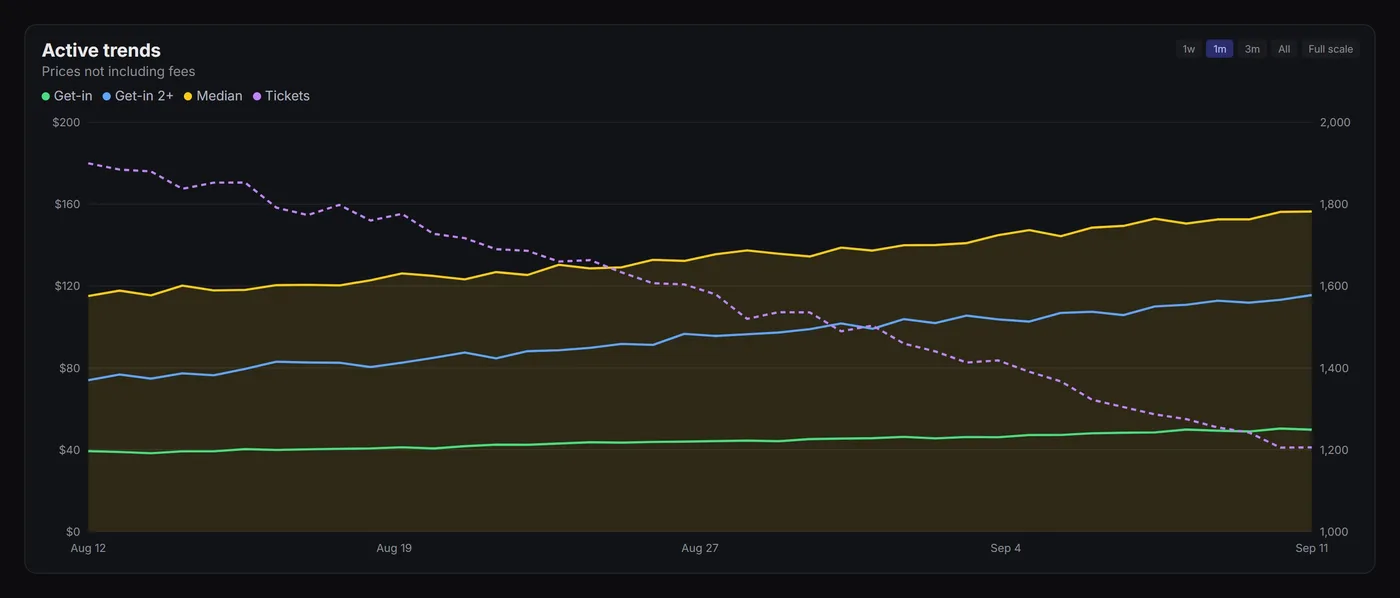
Active trends
Get-in and median price against active ticket count, over any window.
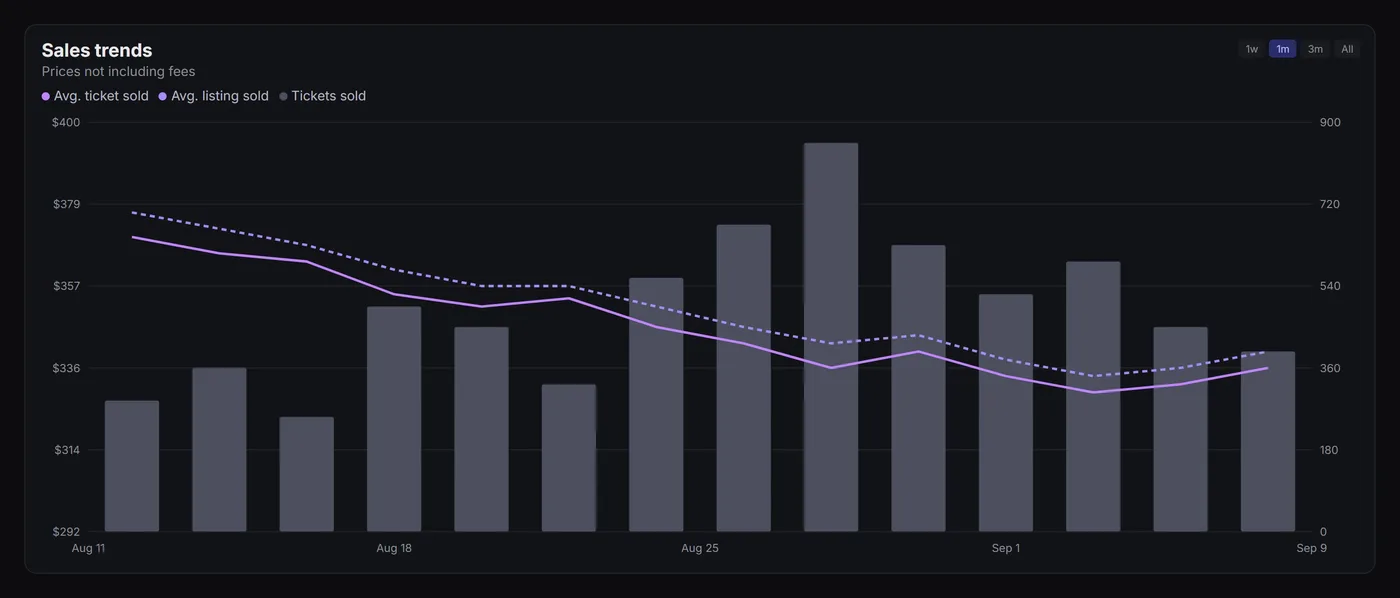
Sales trends
Daily tickets sold and average sold price, side by side.
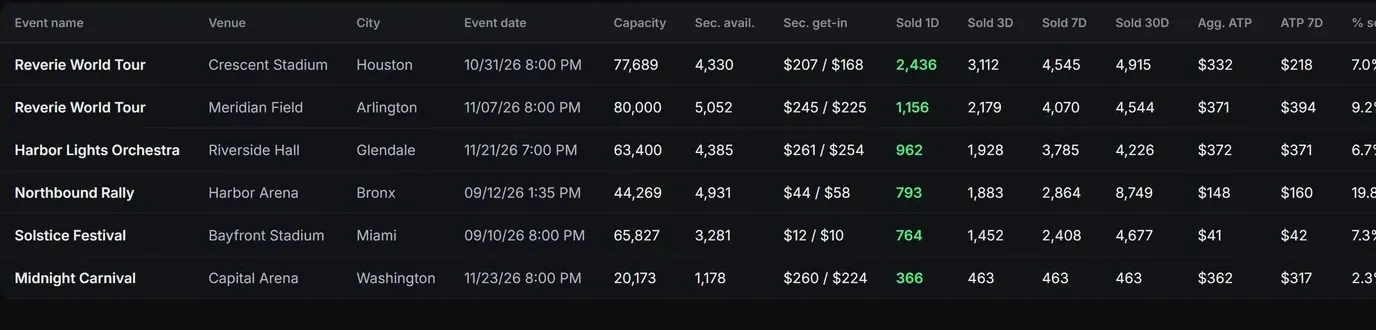
Event rankings
Every event ranked by what sold today, with the movement against last week.
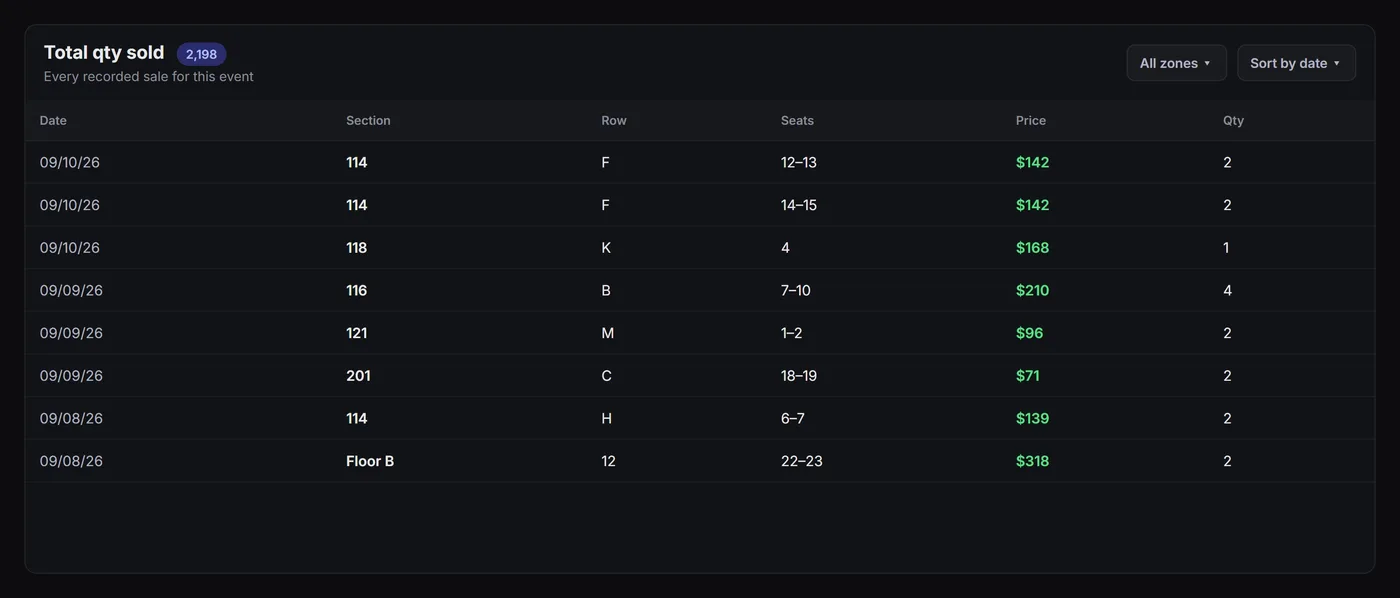
Quantity sold
Recorded sales by section, row and seat, filtered to any zone.
Start with your plan, or walk through it with our team first.
Every tool reads from the same data, so they work best together.
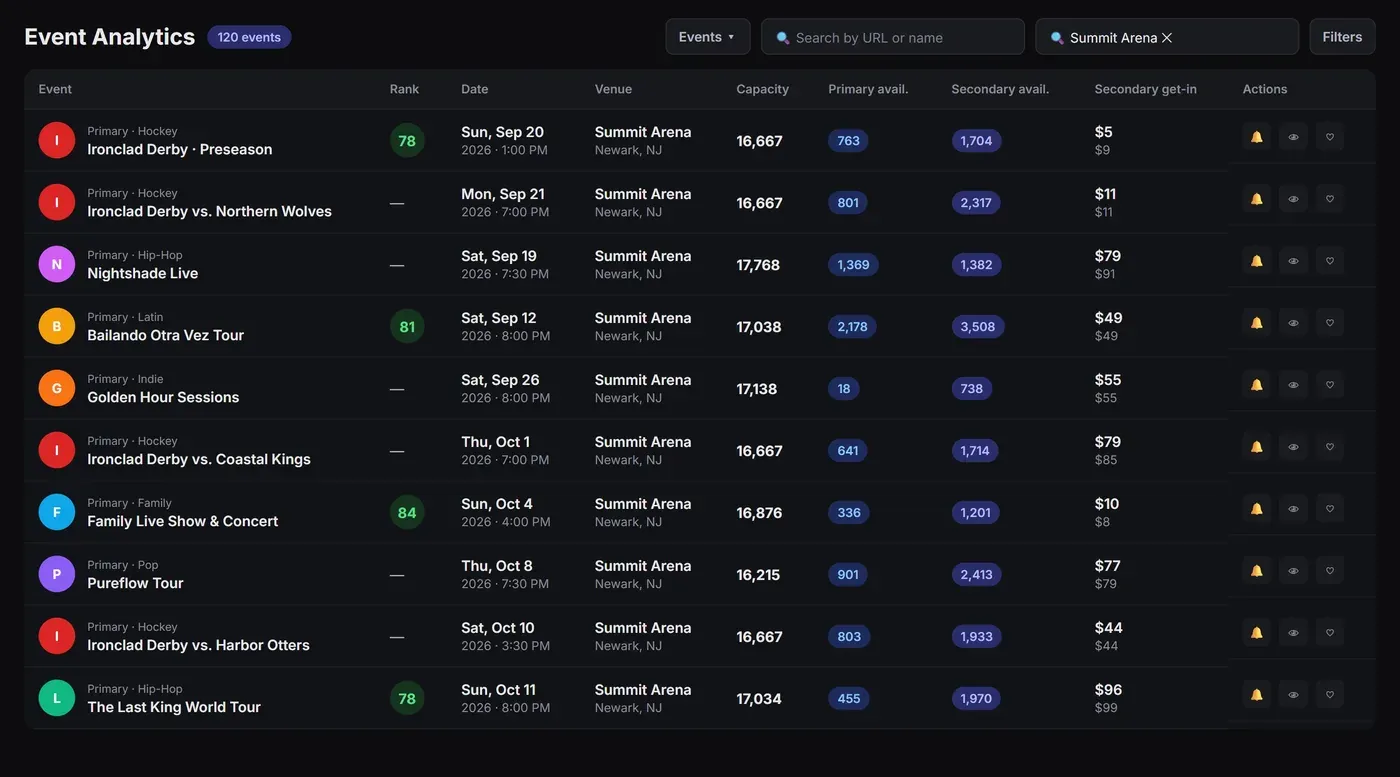
Primary and secondary data for any event
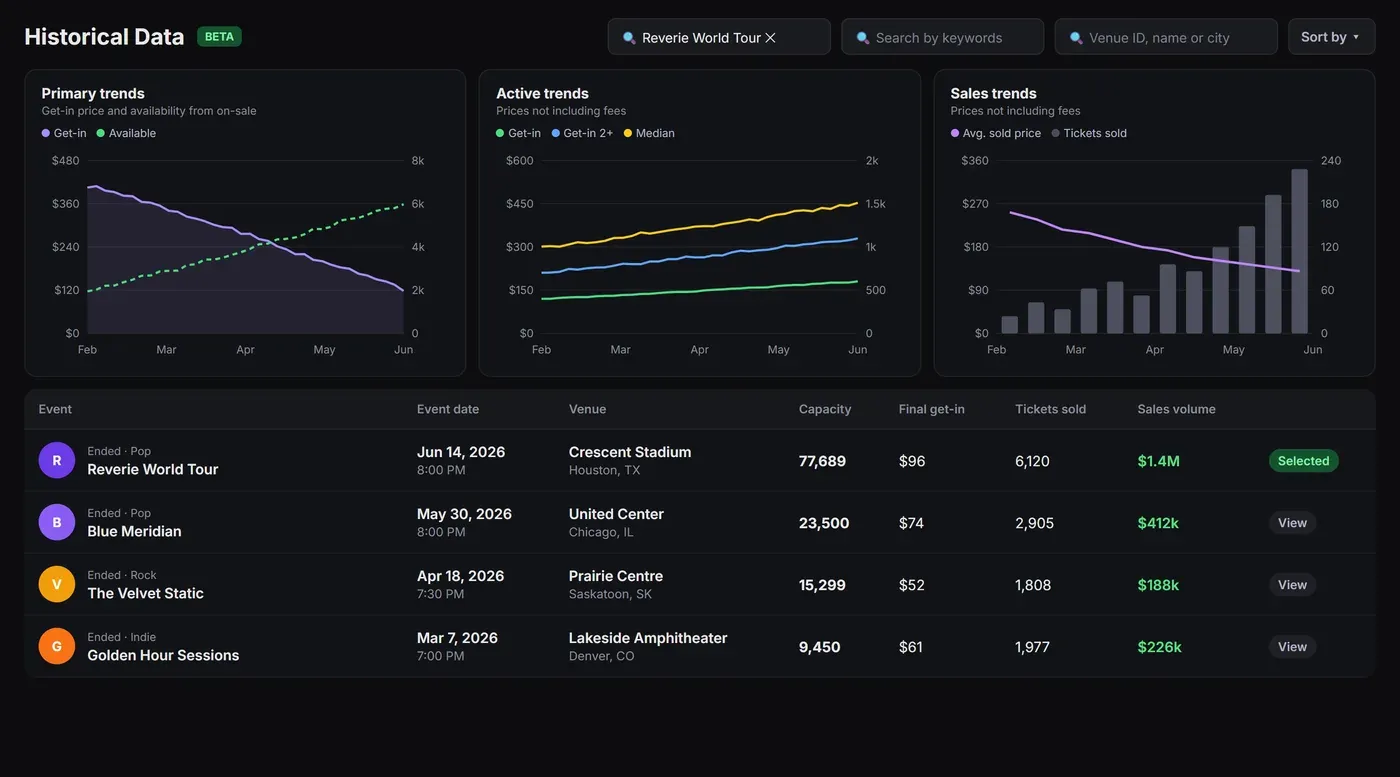
How any past event really sold
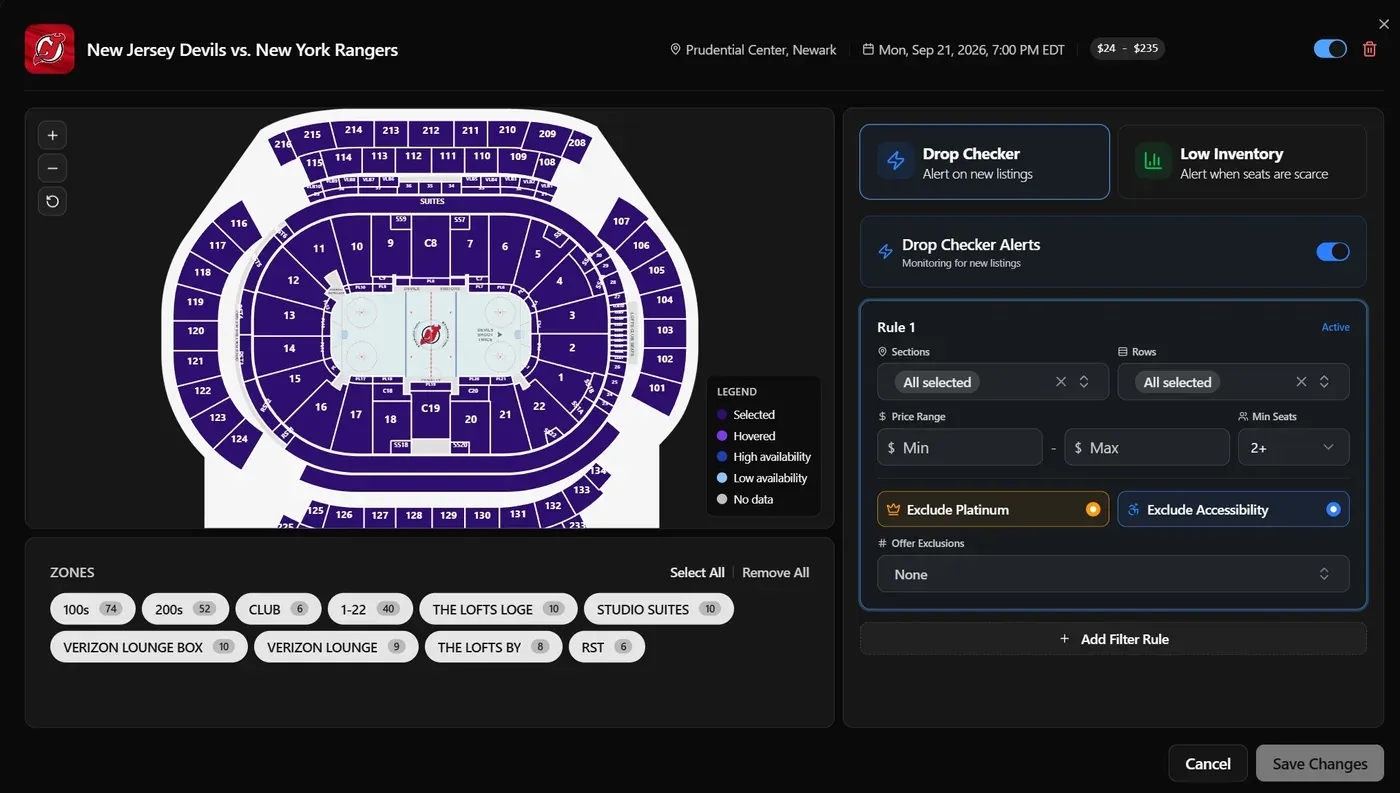
Know the moment inventory moves
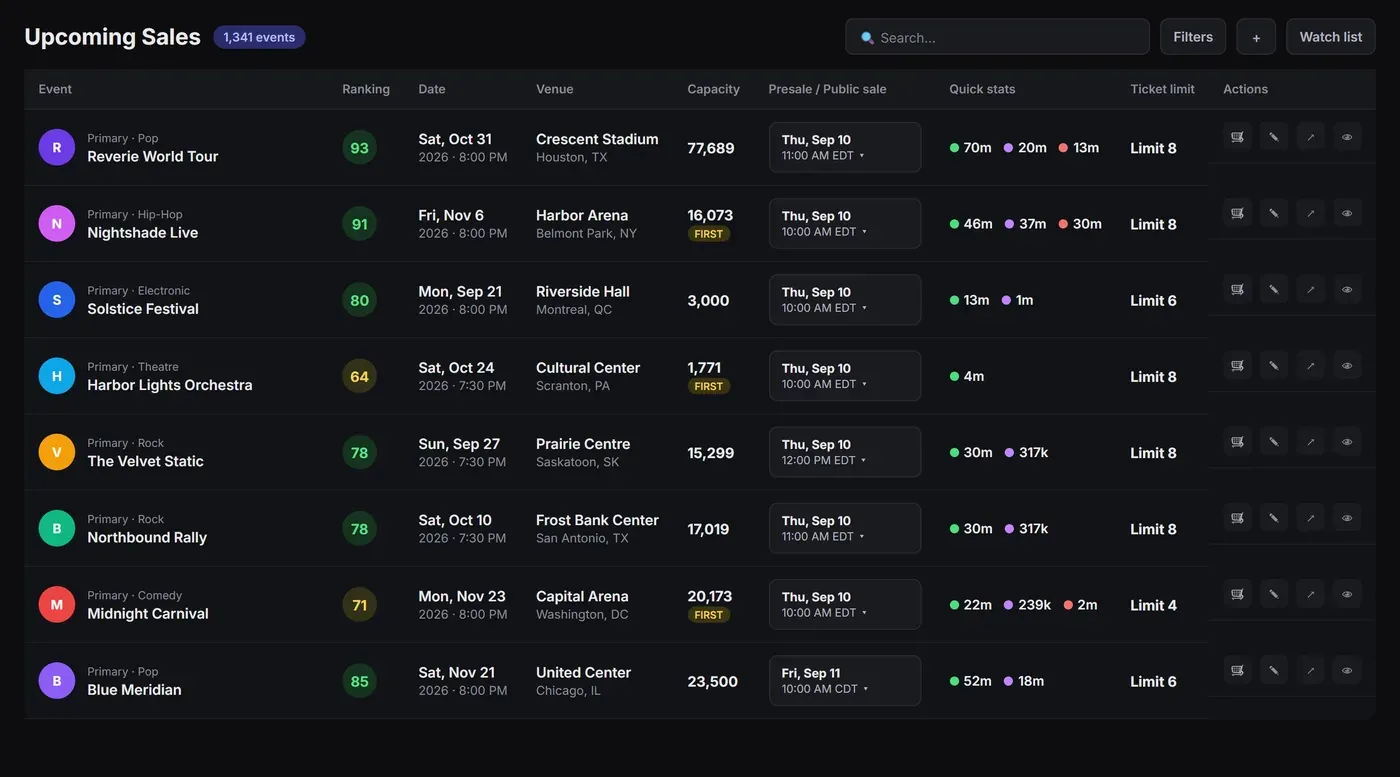
Every presale and on-sale before it happens
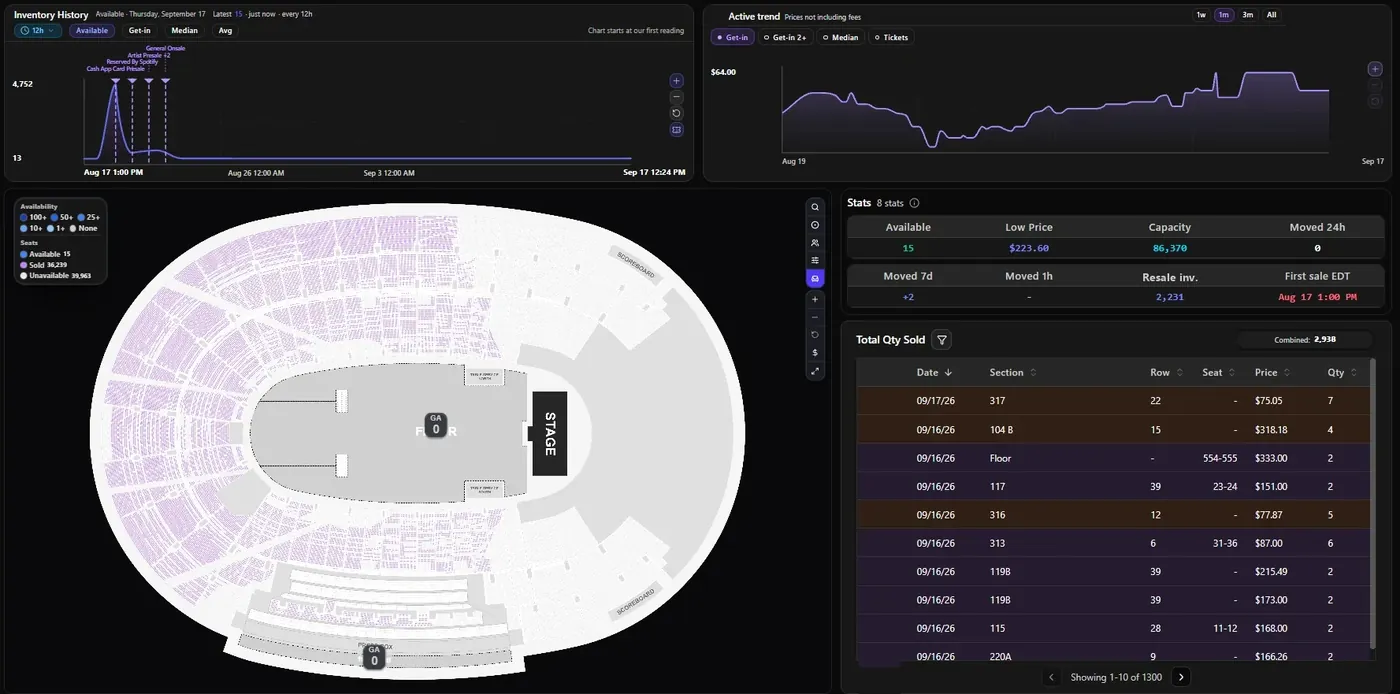
Primary inventory seat by seat, live
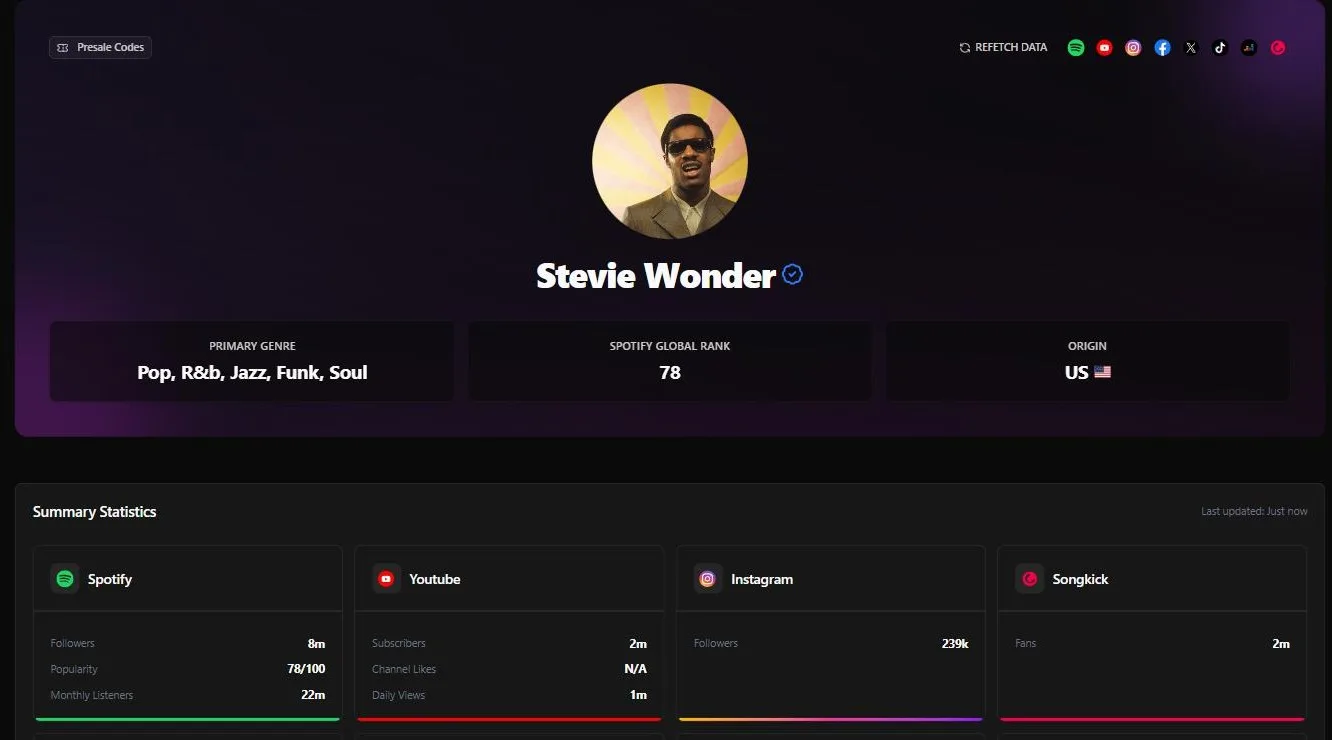
Audience size and location for any artist
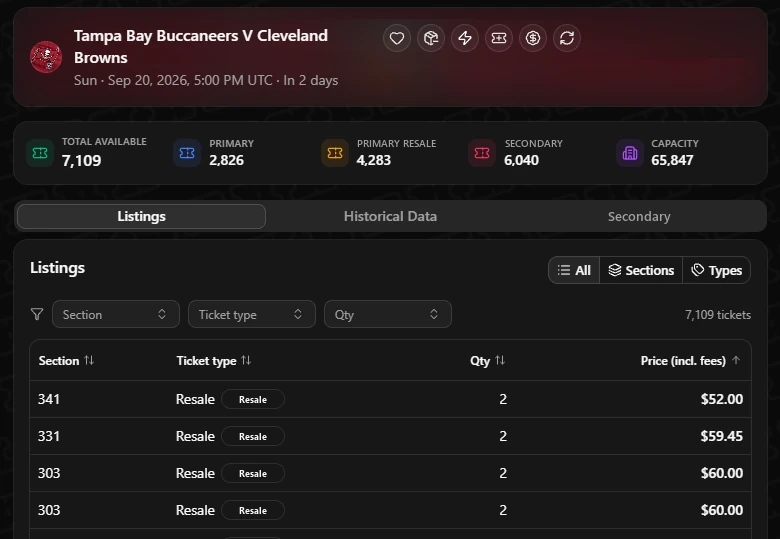
The same data on the ticket page you're on
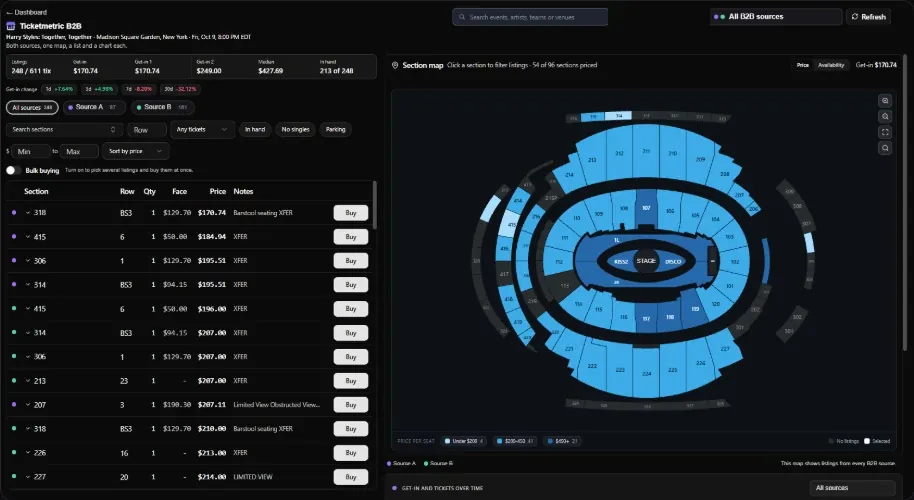
Multiple B2B sources in one dashboard